Pygame is primarily a library for game development, but it can also be effectively used for 2D data visualization. Its ability to handle graphics, animations, and real-time updates makes it suitable for visualizing sensor data, simulations, and dynamic datasets.
Pygame for Data Visualization
- Real-time rendering – Ideal for continuously updating datasets like LiDAR, sensor readings, or robotics data.
- Custom graphics – You can create unique visualization styles without being restricted to standard charting tools.
- Event handling – Useful for interactive visualizations where user input affects the displayed data.
- Animations – Can be used to animate data changes over time.
Key Concepts for Visualization in Pygame
1. Displaying Data Points
- Use
pygame.draw.circle()orpygame.draw.rect()to represent points. - Example: Visualizing LiDAR sensor readings as a point cloud.
2. Drawing Lines and Graphs
pygame.draw.line()to connect data points for line graphs.pygame.draw.polygon()to create filled areas for a heatmap-like effect.
3. Handling Real-time Data Streams
- Use
pygame.time.Clock()to control frame rate. - Fetch data from external sources like a sensor or file.
- Update the display dynamically.
4. Color Mapping
- Use RGB values to represent different data intensities.
- Example: Darker shades for higher values in heatmaps.
5. Interactive Elements
- Use
pygame.MOUSEBUTTONDOWNorpygame.KEYDOWNevents for zooming, panning, or toggling display options.
Applications in Robotics and IoT
- LiDAR Data Visualization: Display real-time LiDAR scans in a 2D environment.
- Sensor Readings: Represent temperature, humidity, or distance measurements dynamically.
- Path Planning: Show robot movements and obstacles in an environment.
- Heatmaps: Visualize intensity variations over a grid.
Example code for visualizing data from Lidar in Pygame:
code:
import pygame, math, serial, numpy
pygame.init()
#constant based on lidar resolution
LIDAR_RESOLUTION = 240
#lidar resolution divided by 4 to simplify the visualization
VISUALIZATION_RESOLUTION = 240
distances_list = []
first_run = True
def GetDataFromArduino(line):
global distances_list, first_run
#[:-3] get rid of end of line sign and additional comma separator that is sent from arduino
data = line[:-3]
print(data)
d_list= data.split(“,”)
return d_list
def GenerateLinePositions(numberOfLines):
angle = 360/numberOfLines
lines = []
for x in range(numberOfLines):
lines.append([300 * math.cos((x+1)*angle/180 * math.pi), 300 * math.sin((x+1)*angle/180 * math.pi)])
return lines
line_positions = GenerateLinePositions(VISUALIZATION_RESOLUTION)
# Set up the drawing window
screen = pygame.display.set_mode([800, 800])
sysfont = pygame.font.get_default_font()
font1 = pygame.font.SysFont(sysfont, 72)
file1 = open(‘D:githubMachine-Learning-Robotdatadata7.txt’, ‘r’)
Lines = file1.readlines()
for line in Lines:
distances = GetDataFromArduino(line)
print(len(distances))
if(len(distances) == LIDAR_RESOLUTION):
# Did the user click the window close button?
for event in pygame.event.get():
if event.type == pygame.QUIT:
running = False
# Fill the background with white
screen.fill((250, 250, 250))
for x in range(VISUALIZATION_RESOLUTION):
if distances[x] == 0:
distances[x] = 20
a = int(float(distances[x]))/2000
if x in [136, 137, 138, 139, 140, 141, 142, 143, 144, 145, 146, 147, 148, 149, 150, 151, 152, 153, 154, 155, 156, 157, 158, 159, 160, 161, 162, 163, 164, 165, 166, 167, 168, 169, 170, 171, 172, 173, 174, 176, 184, 185, 186, 187, 188, 189, 190, 191, 192, 193, 194, 195, 196, 197, 198, 199, 200, 201, 202, 203, 204, 205, 206, 207, 208, 209, 210, 211, 212, 213, 214, 215, 216, 217, 218, 219, 220, 221, 222, 223]:
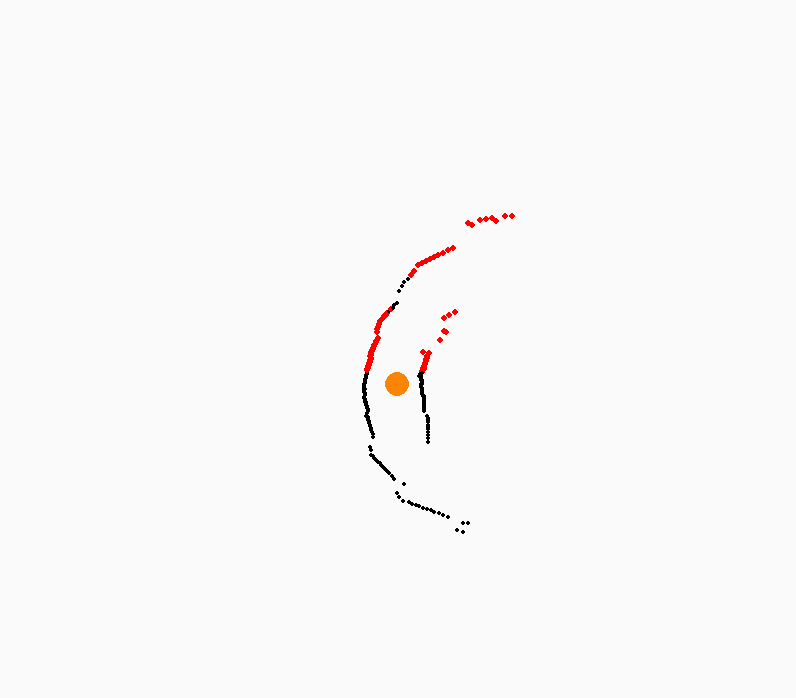
pygame.draw.circle(screen, (255,0,0), (line_positions[x][0]*a+400, line_positions[x][1]*a+400), 3)
else:
pygame.draw.circle(screen, (0,0,0), (line_positions[x][0]*a+400, line_positions[x][1]*a+400), 2)
pygame.draw.circle(screen, (252, 132, 3), (400, 400), 12)
# Flip the display
pygame.display.flip()
pygame.time.wait(200)
pygame.quit()
output: