Area plots are a type of data visualization that show quantities as a series of filled areas, often used to represent cumulative totals over time or to highlight the contribution of various categories to a whole. They are particularly useful for displaying multiple data series with stacked areas to show the overall trend and the relative contribution of each series.
Key Features of Area Plots
- Filled Areas: The space between the axis and the line is filled with color or shading, making it easy to see the volume of data.
- Stacked Areas: When multiple data series are involved, they are often stacked on top of each other to show the cumulative effect.
- Time Series Data: Area plots are commonly used to visualize data over time, but they can also be used for other continuous variables.
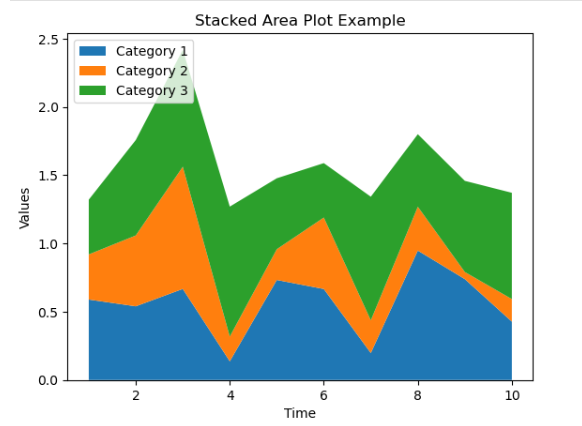
creating an Area Plot Using Matplotlib in Python
Matplotlib is a popular library in Python for creating static, animated, and interactive visualizations. Below is an example of how to create an area plot using Matplotlib.
Example Code
import matplotlib.pyplot as plt
import numpy as np
# Sample data
categories = [‘Category 1’, ‘Category 2’, ‘Category 3’]
x = np.arange(1, 11) # Time points
# Generating random data for demonstration
y1 = np.random.rand(10)
y2 = np.random.rand(10)
y3 = np.random.rand(10)
# Stacked area plot
plt.stackplot(x, y1, y2, y3, labels=categories)
# Adding titles and labels
plt.title(‘Stacked Area Plot Example’)
plt.xlabel(‘Time’)
plt.ylabel(‘Values’)
plt.legend(loc=’upper left’)
# Show plot
plt.show()
Conclusion
Area plots are a powerful tool for visualizing data in a way that highlights both individual and cumulative contributions over time. By using libraries like Matplotlib, you can create informative and visually appealing area plots to help convey complex data in an easy-to-understand format.