·The integration dashboard shows you the status of every flow that ran for the last 30 day. From here you can watch your flows run in real-time, review errors as they occur, and review your run times. The dashboard has two tabs: Running flows and Completed flows.
· 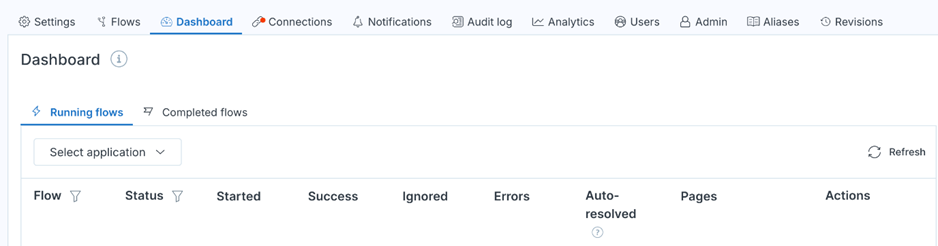
Running flows
You can see any currently running or queued flows from this tab and review any real-time errors. For larger integrations, you can filter by flow name and status.
Status – When flows are processing, the Status column displays an In progress message.
Started – The Started column displays the timestamp for your flow’s latest run.
Success – display the number of successful record.
Ignored – number of any ignored records.
Errors – a live count of accumulating errors and auto-resolved errors .
Completed flows
You can see all your canceled and completed flows in this tab, along with all the errors that occurred during the flow run.
Sort your flows by flow name and by Completed date range. Your date range is customizable, from the current date to the last 30 days.
Last open error – The Last open error displays the timestamp for the most recent error.
Errors – The Errors column displays the number of errors in your flow, not including open errors. Auto-resolved – The Auto-resolved column displays the errors that were resolved by integrator.io. User-resolved – The User-resolved column logs errors that were manually resolved by the user.
Runs – The number of times the flow has completed for the selected date range.
Average run time- The average time the flow takes to complete running. The run time includes the time the flow is “Waiting in queue” status.