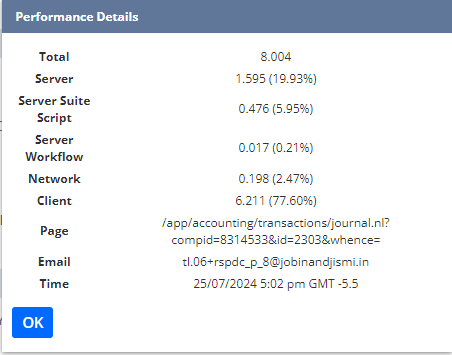
Double-click the Oracle NetSuite logo in the upper-left corner of any page in the NetSuite application to display the Performance Details window. This window displays performance details that can be helpful for troubleshooting. This information is different for each user.

The Performance Details window includes the following data:
Total – Displays the total page load time (in seconds).
Server Suite Script – Displays the server time that was spent on server-side scripting (in seconds and as a percentage of total server time).
Server Workflow – Displays the amount of server time that was spent on work flows (in seconds and as a percentage of total server time).
Network – Displays the total page load time for data to travel from the NetSuite servers to the computer (in seconds and as a percentage of total server time).
If this row has the highest percentage in the list, the problem could be related to the internet service provider (ISP). See Troubleshooting Network Performance.
Client – Displays the total page load time for the computer to render the page (in seconds and as a percentage of total server time).
If this row has the highest percentage in the list, see Troubleshooting Client Performance.
Page – Displays the web address of the page you are viewing in the application.
Email – Displays the email address associated with the account.
Time – Displays the system date and time.
The information in the Performance Details window is based on the data sent to the client from the server.