Log Explorer is a tool used for analyzing and visualizing log data generated by various GCP services. It’s part of the Cloud Logging service and provides a user-friendly interface to search, filter, and view logs collected from applications, infrastructure, and other resources within GCP.
Log Explorer allows you to:
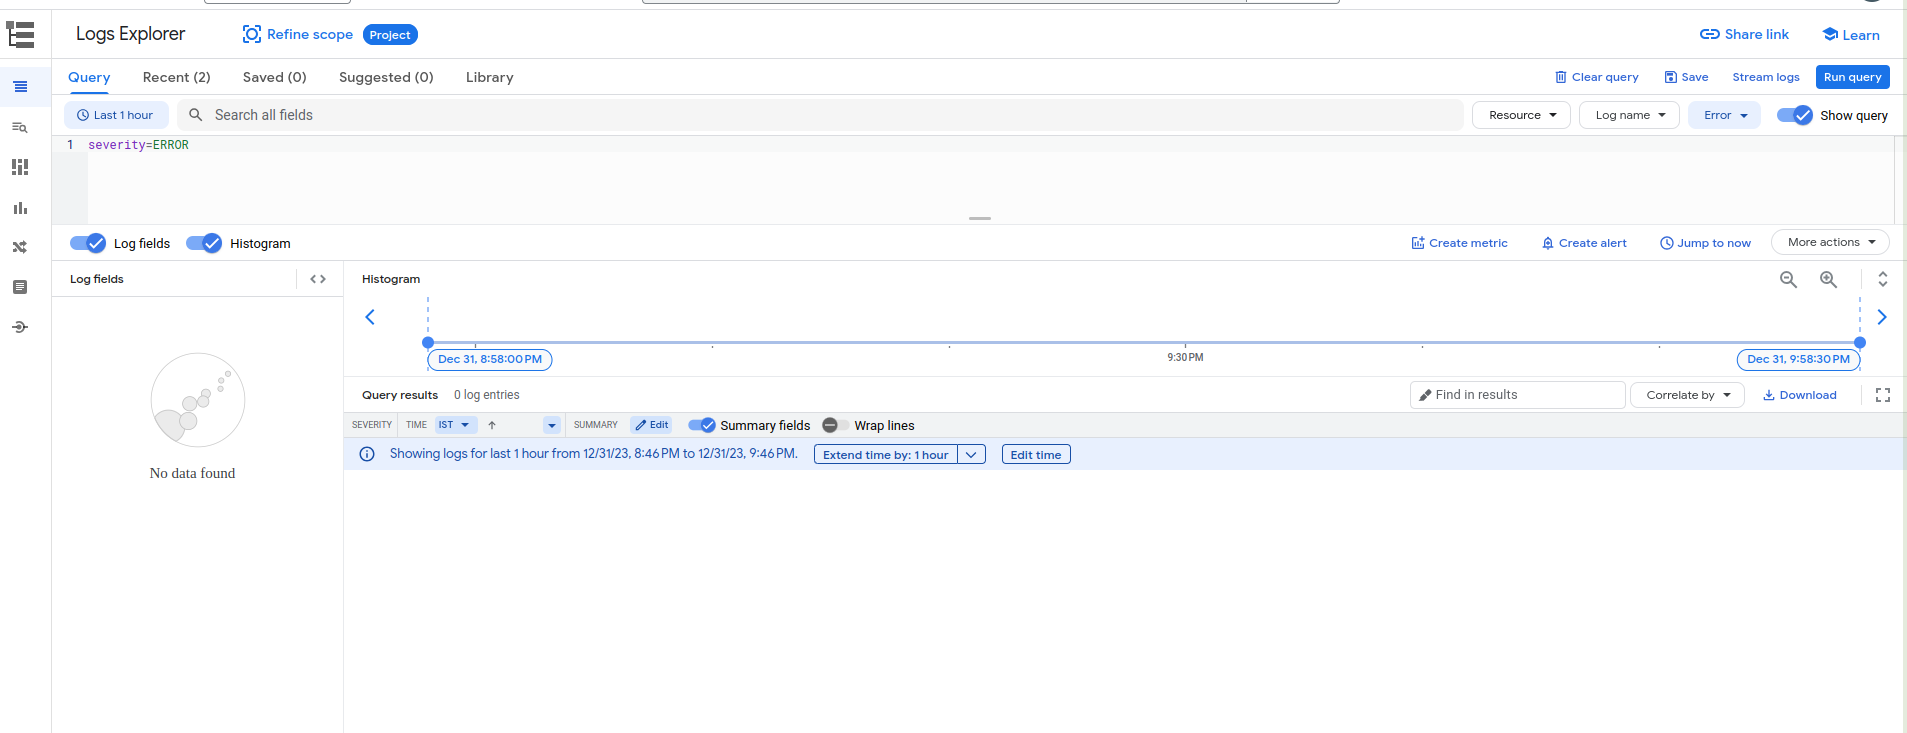
- Search and filter logs: You can search for specific log entries based on keywords, timestamps, severity levels, or custom parameters. Filtering options help narrow down the scope of logs to focus on particular events or issues.
- View log details: Once logs are retrieved, Log Explorer presents them in an easily readable format, displaying relevant details about each log entry, such as timestamp, severity, log message, and associated metadata.
- Create visualizations: It enables the creation of visual representations like charts and graphs based on log data, aiding in the analysis of trends, patterns, and anomalies within the logs.
- Export and manage logs: Log Explorer allows exporting logs for further analysis or archival purposes. Additionally, it provides functionalities to manage log retention policies and access controls.
path : GCP console -> Navigation Menu -> Logging -> Logs Explorer
To get the log of cuurent project : Choose Resources -> VM Instance.
You can set filter as per the time.
By utilizing Log Explorer effectively, users can gain insights into system behavior, diagnose issues, monitor performance, and ensure compliance by analyzing log data produced by various GCP services.