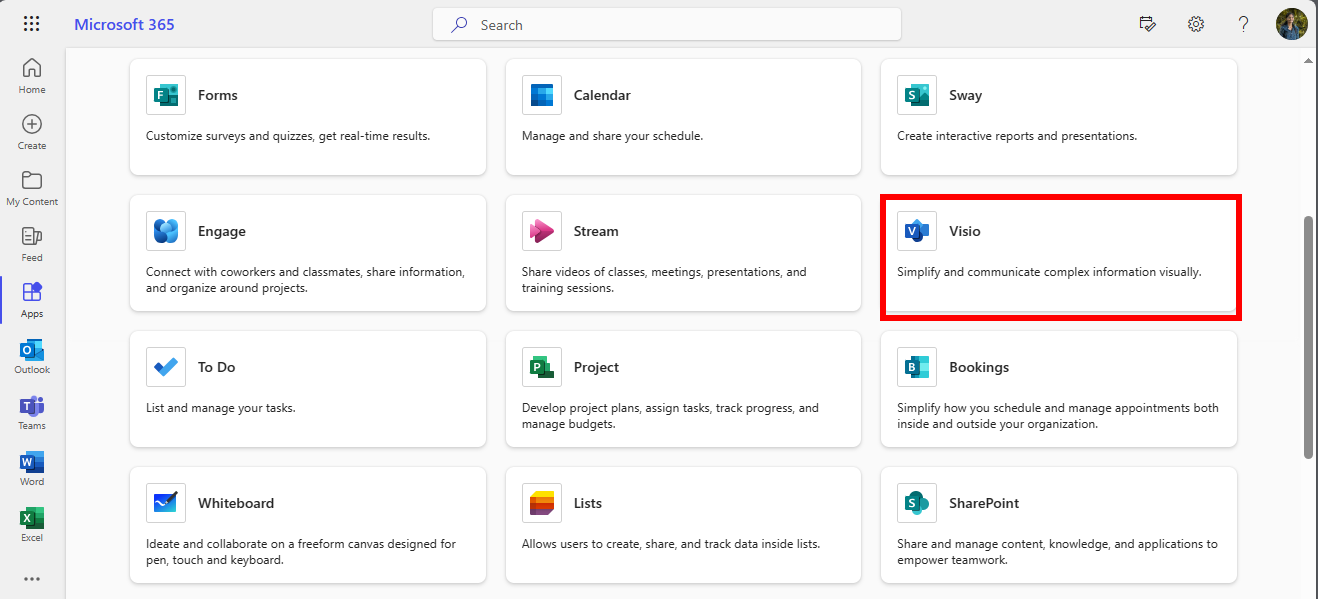
In our dynamic work environment, efficient communication and visualization of processes are essential. Microsoft 365 provides a valuable tool, Visio Chart, available in the “Explore all your apps” section, to create flowcharts seamlessly within our system.
Visio is a versatile diagramming and flowchart tool that enables users to represent complex information visually. It offers a user-friendly interface and a range of templates to simplify the creation of flowcharts, process maps, and diagrams.
- Navigate to “Explore all your apps”: Begin by accessing the Microsoft 365 dashboard and selecting the “Explore all your apps” section.
- Locate Visio Chart: In the list of available apps, you’ll find Visio Chart. Click on it to open the application.
- Start Creating Flowcharts: Once in Visio Chart, you can choose from various templates or start with a blank canvas. The intuitive drag-and-drop interface allows you to add shapes, connectors, and text effortlessly.
The Visio chart provides a user-friendly interface and a range of features that simplify the creation of detailed and organized flowcharts, making it a valuable tool for enhancing clarity in your visual representations.